
HOME / POSTS / TOWARDS HUMAN HAPTIC GESTURE INTERPRETATION FOR ROBOTIC SYSTEMS
Towards Human Haptic Gesture Interpretation for Robotic Systems
September 2021 Bianchini
This post goes along with the paper I published at the International Conference on Intelligent Robots and Systems (IROS) in 2021 on research I conducted during my masters program. My co-authors are Stanford researcher, Prateek Verma, as well as Stanford faculty Ken Salisbury.
Interested readers can refer to our paper for all of the details (on publisher page, or on arxiv). However this post should provide a high-level sense of the contributions.
Video 1: Short 1-minute video accompanying the paper.
Video 2: Longer 15 minute presentation recording.
Paper abstract
Physical human-robot interactions (pHRI) are less efficient and communicative than human-human interactions, and a key reason is a lack of informative sense of touch in robotic systems. Interpreting human touch gestures is a nuanced, challenging task with extreme gaps between human and robot capability. Among prior works that demonstrate human touch recognition capability, differences in sensors, gesture classes, feature sets, and classification algorithms yield a conglomerate of non-transferable results and a glaring lack of a standard. To address this gap, this work presents 1) four proposed touch gesture classes that cover an important subset of the gesture characteristics identified in the literature, 2) the collection of an extensive force dataset on a common pHRI robotic arm with only its internal wrist force-torque sensor, and 3) an exhaustive performance comparison of combinations of feature sets and classification algorithms on this dataset. We demonstrate high classification accuracies among our proposed gesture definitions on a test set, emphasizing that neural net-work classifiers on the raw data outperform other combinations of feature sets and algorithms.
Citation
@inproceedings{bianchini2021towards,
  title={Towards Human Haptic Gesture Interpretation for Robotic Systems},
  author={Bianchini, Bibit and Verma, Prateek and Salisbury, J Kenneth},
  booktitle={2021 IEEE/RSJ International Conference on Intelligent Robots and Systems (IROS)},
  pages={7334--7341},
  year={2021},
  organization={IEEE},
  url = {https://ieeexplore.ieee.org/abstract/document/9636015},
  arxiv = {2012.01959}
}
Motivation

Figure 1: The dashed encircled layer 2 is what this paper aimed to accomplish.
With raw tactile sensor data at the lowest level, and task-level commands at the highest level, this paper aimed to build out the middle level, which can capture fine but semantically meaningful touch events in raw sensor data. To do this, we first defined a dictionary of human-to-robot touch gestures that we wanted our pipeline to be able to differentiate. There are other papers in the literature that define their own definition sets, so we defined our gestures in relation to their definitions to enable later comparisons to that body of work. See Table 1 in our paper to see how our set of {tap, touch, grab, slip} compares to other works.


Figure 2: At left, an example of a human initiating a "grasp" gesture on the end effector of a robot arm. At right, Groupings of each gesture type of similar duration as they appear through force sensor readings.
For our work, we used a UR5e robot arm for its internal force-torque sensor to collect our data. This way, any capabilities we developed for interpreting that raw sensor data could be immediately put to use in some physical human-robot interaction task, since the UR5e is a common research platform designed for collaborative human-robot interaction.
Approach
We essentially turned this into a classification problem: given the past few milliseconds of force-torque data, what tactile gesture is the human inflicting on the robot, if any? Thus any classifier we created needed to decide between the 5 options of our touch gestures plus {no contact}.

Figure 3: The six feature sets and three classification algorithms we tested in combination with each other, totaling to 11 models.
It wasn't obvious what combination of signal processing features and classification algorithm would provide the best results, so we explored many combinations, including manual construction, learned compressions (via an autoencoder framework), principal and independent component analysis (PCA and ICA), and the raw sensor data itself.
Manually constructed feature set
For the manually constructed feature sets, we chose 41 total features that could be calculated from the 600 millisecond force-torque snippets. These features included slope information, curvature, standard deviation, polynomial fit coefficients, window main-lobe matching, and spectral information. The spectral information in particular made distinguishing contact from non-contact snippets fairly simple (see Figure 4 below). Window main-lobe matching compares an input signal to a pre-selected template signal, so this was a useful feature to calculate for finding the impulse-like tap events (see Figure 5 below for how to calculate).

Figure 4: An example of how spectral information can distinguish contact versus no contact.

Figure 5: Equations 1-3 from the paper. Window main-lobe matching compares an input signal (X(t)) to a pre-selected template signal (W(t)). The above shows how to compute the normalized correlation error, which is low if the data points closely resemble the template.
Neural Network

Figure 6: Performance by hyperparameter combination.
We performed a hyperparameter search for our neural network, which performed 1 dimensional temporal convolutions. The hyperparameters we explored were network topology (e.g. number of layers and number of neurons per layer), learning rate, filters, and dropout rate. See Figure 6 above for the validation set accuracy for each model with hyperparameter combination we tested. The horizontal line indicates the final test set accuracy of the model we chose. Validation set t-SNE and filter activation plots are shown below in Figure 7, which exposes which tactile gestures are most similar to which other gestures.

Figure 7: t-SNE embedding (left) and filter activations (right) on the validation set.
Results

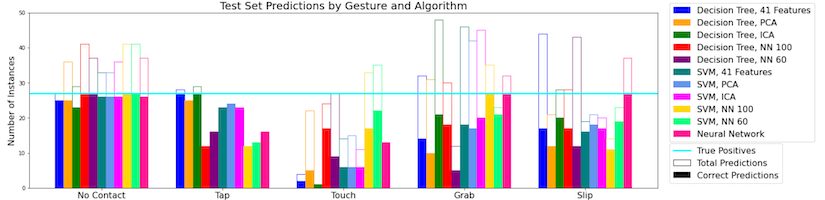
Figure 8: Results on a test set.
We found that the neural network classifier with the raw sensor data as input performed the best overall. See Figure 8 above for the breakdown across all 11 models. For a little more granularity, we can look at the confusion matrices for each model. See Figure 9 below for 3 such confusion matrices.

Figure 9: Confusion matrices for the top performing decision tree, SVM, and neural network classifiers.
The above confusion matrices expose the weaknesses of each model. For example, the decision tree with ICA feature set seldom predicted touch gestures, which likely skewed its performance upwards since it was more likely to guess the other gestures correctly.
Comparison to performances in the literature
I refer the interested reader to our paper (Section V) for more details, but the TLDR is that we were able to show that our algorithms matched the performance of other work in the literature using a dataset of a quarter of their dataset's size.